
Get to know more about our products
Empowering your strategy
Jump to

Supply & Demand
Learn how S&D's might develop and know where the surpluses and deficits are.
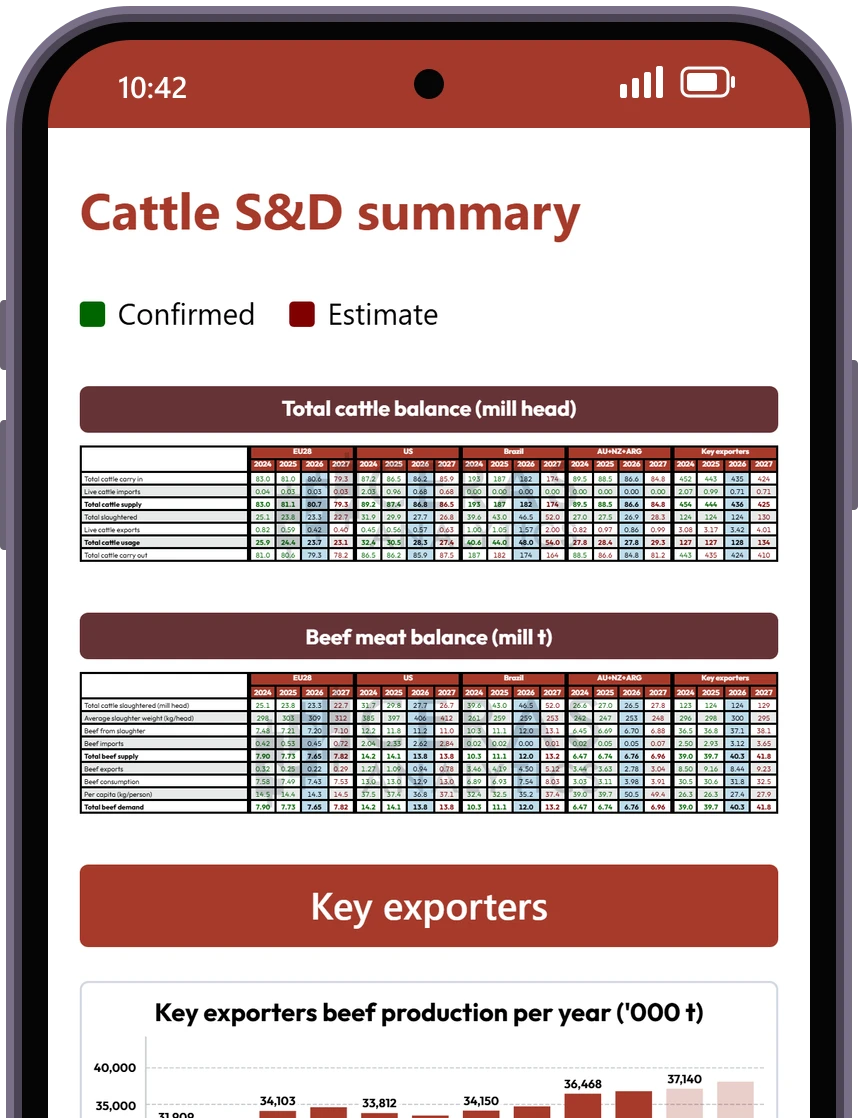
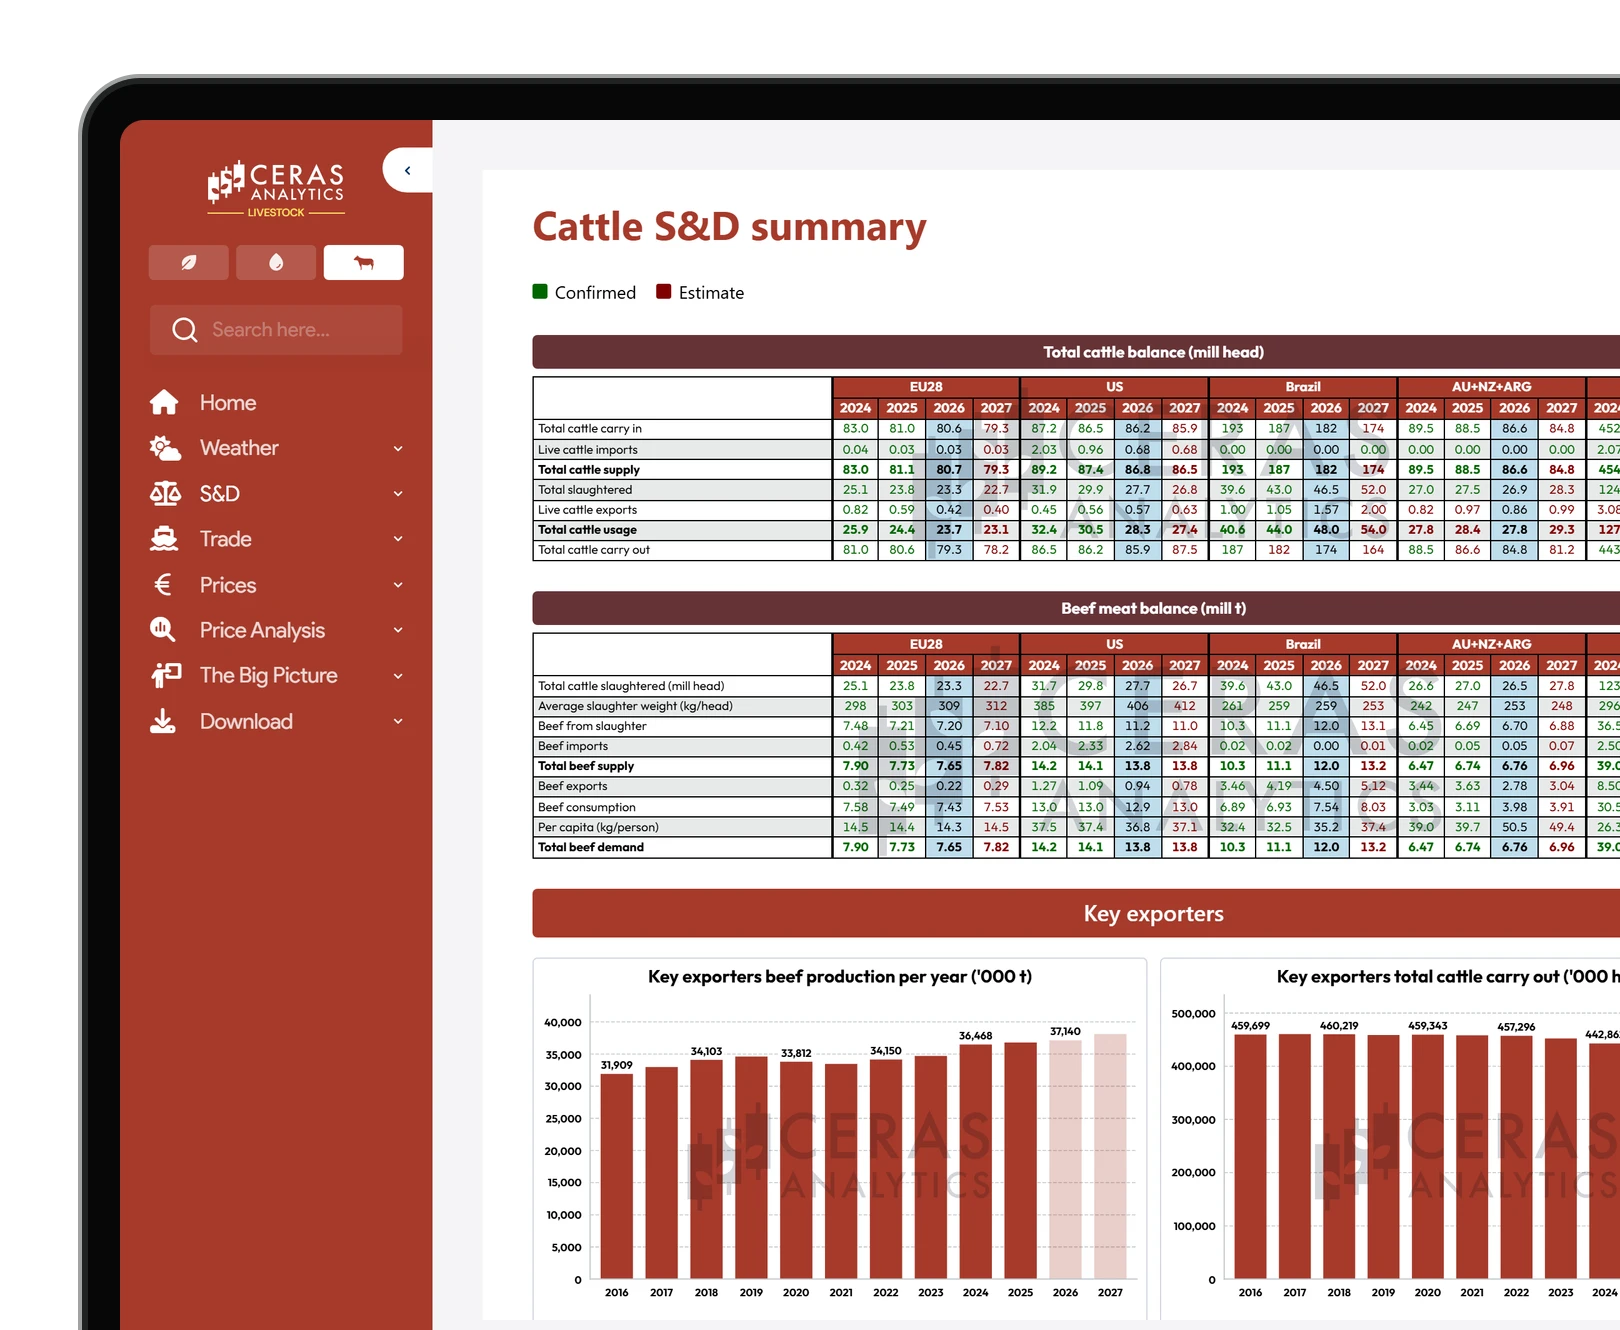
Follow cattle, hogs, poultry and dairy with our fully quantified Supply & Demand (S&D) balance sheets for the world's key producing and exporting countries. Our meat S&Ds follow the chain from herd or flock through slaughter and production to trade, consumption and per capita use, and our dairy S&D follows milk from the cow to butter, cheese and powders. Updated monthly, every balance carries our own forecasts for this year and next, an interactive dashboard with monthly data, and, for cattle, hogs and poultry, illustrated guides to how each market works.
Cattle
Track the beef market from the cow herd to the consumer for the EU28, the US, Brazil, Australia and Argentina, plus a total for the key exporters. Our balances start with the herd on 1 January and follow slaughter, carcass weights, beef production, trade, consumption and per capita use. Herd-cycle indicators such as replacement heifers and the female share of slaughter show where the cycle stands, and for the US we add the cattle-on-feed pipeline of placements and marketings. Monthly and seasonal charts and a breakdown of the main EU producing countries complete the picture.

Trade data
Make sense of global trade movements.
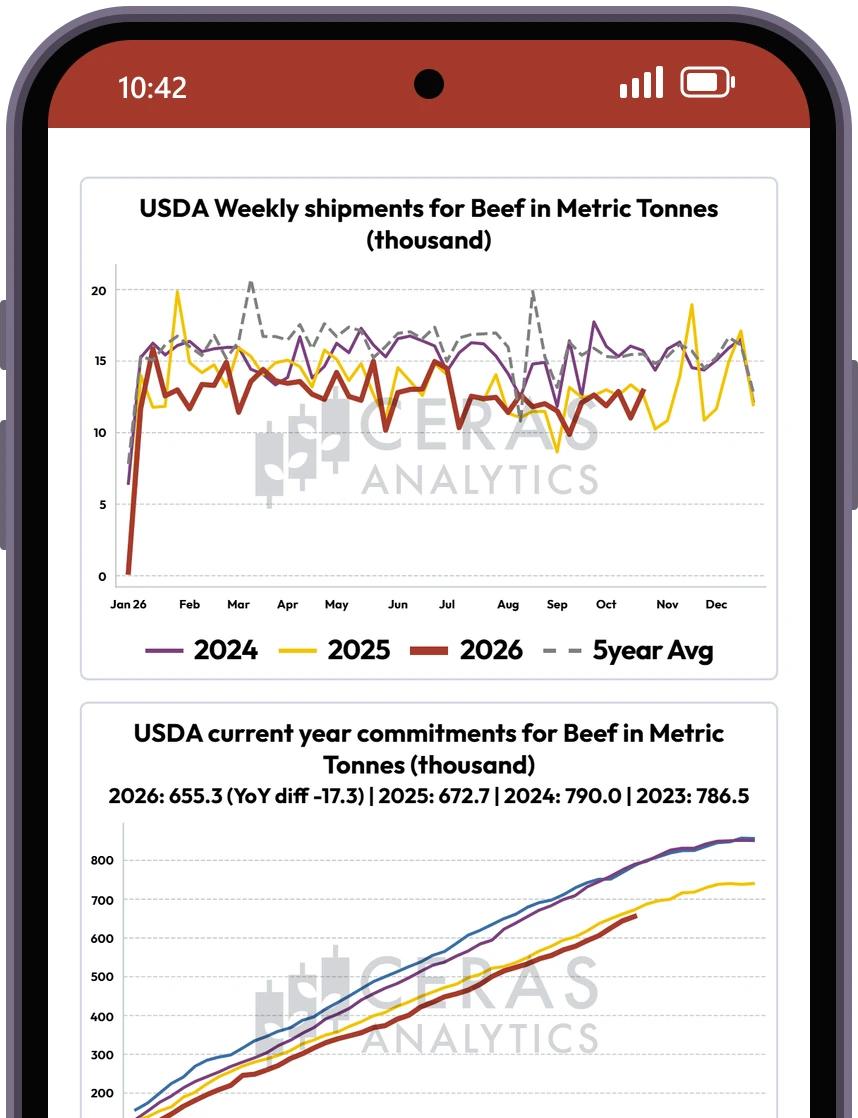
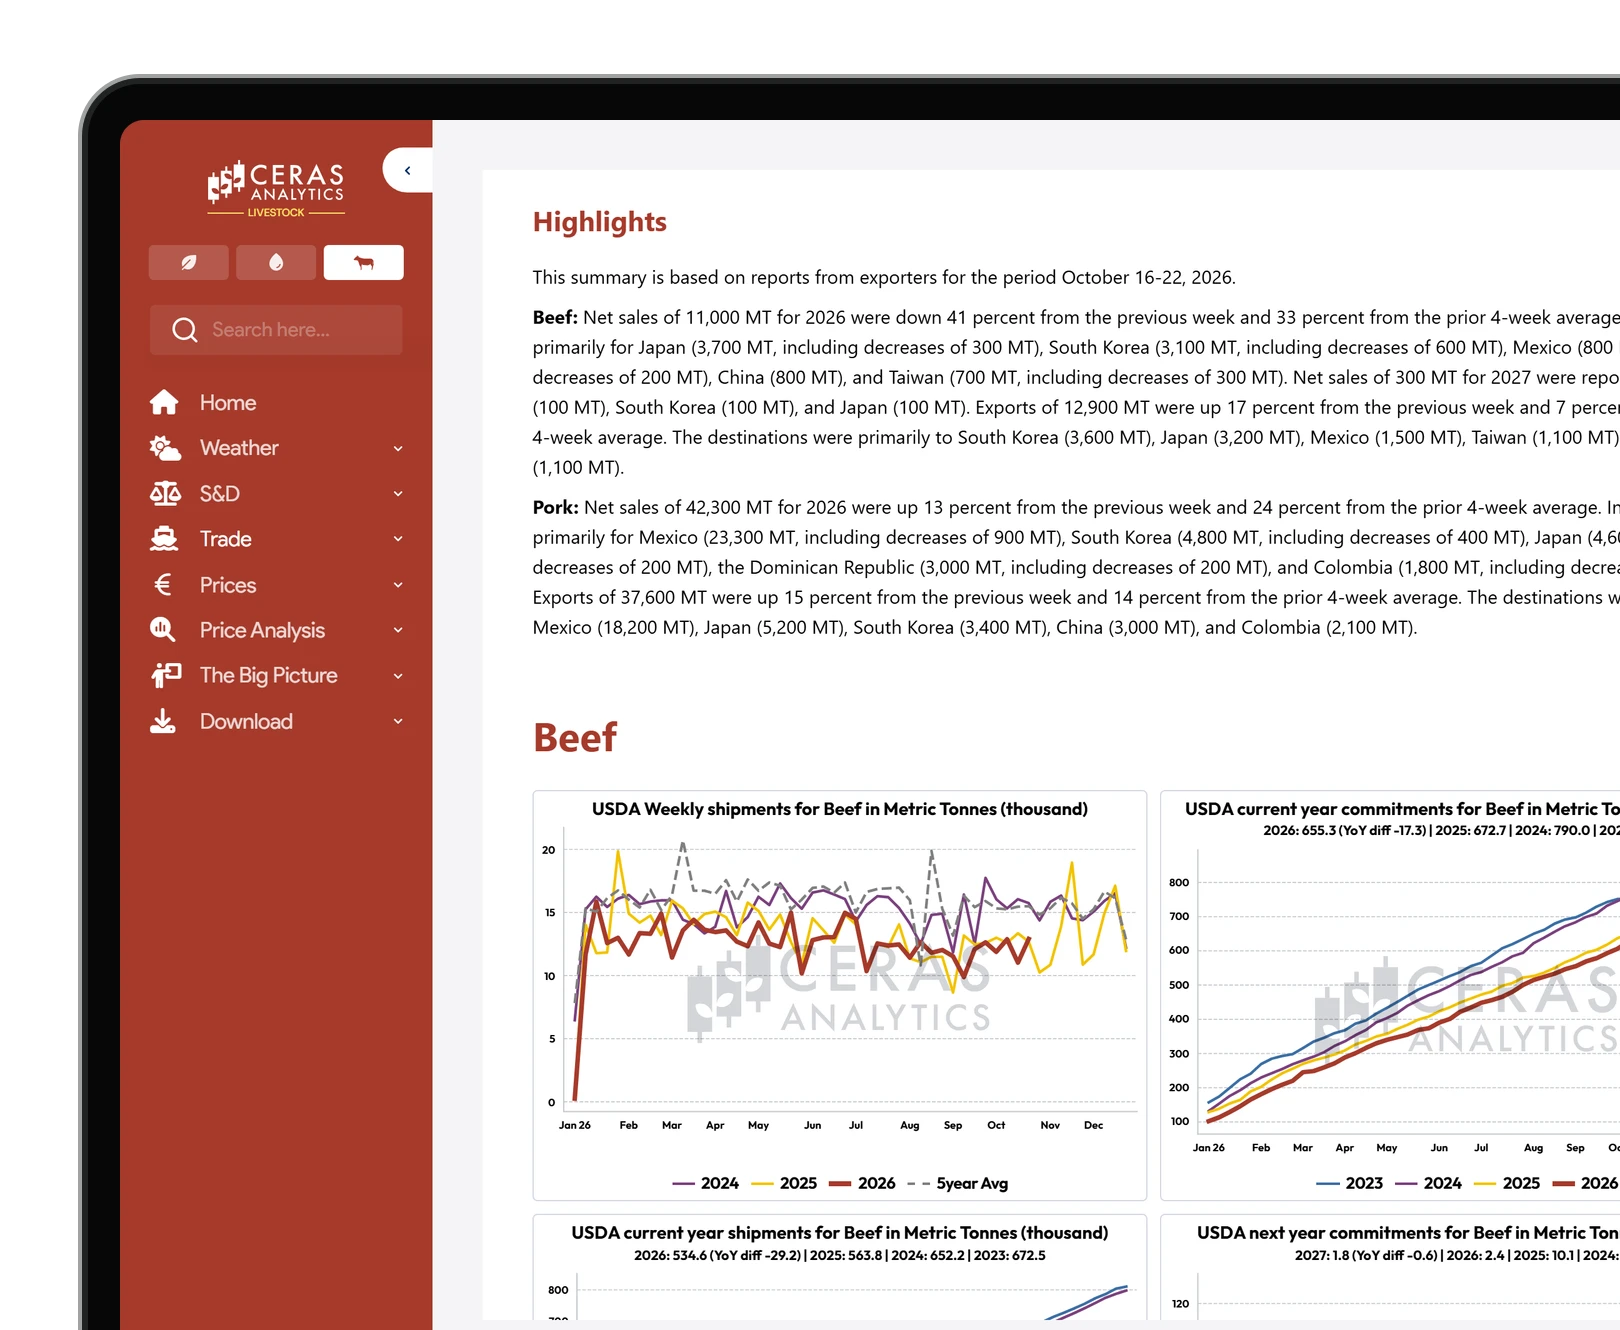
We track and analyse weekly USDA reports on U.S. export sales and shipments to third countries. Our report places this data in historical context, helping you better understand market trends and the potential impact on supply and demand.
USDA sales
Track real export flows. Our weekly US Sales report brings clarity to US livestock exports. It blends reported facts with historical comparisons, helping you put weekly sales into context and assess market potential by livestock category, destination by destination.

Weather
Real time insight for smarter decision-making, in user friendly dashboards.
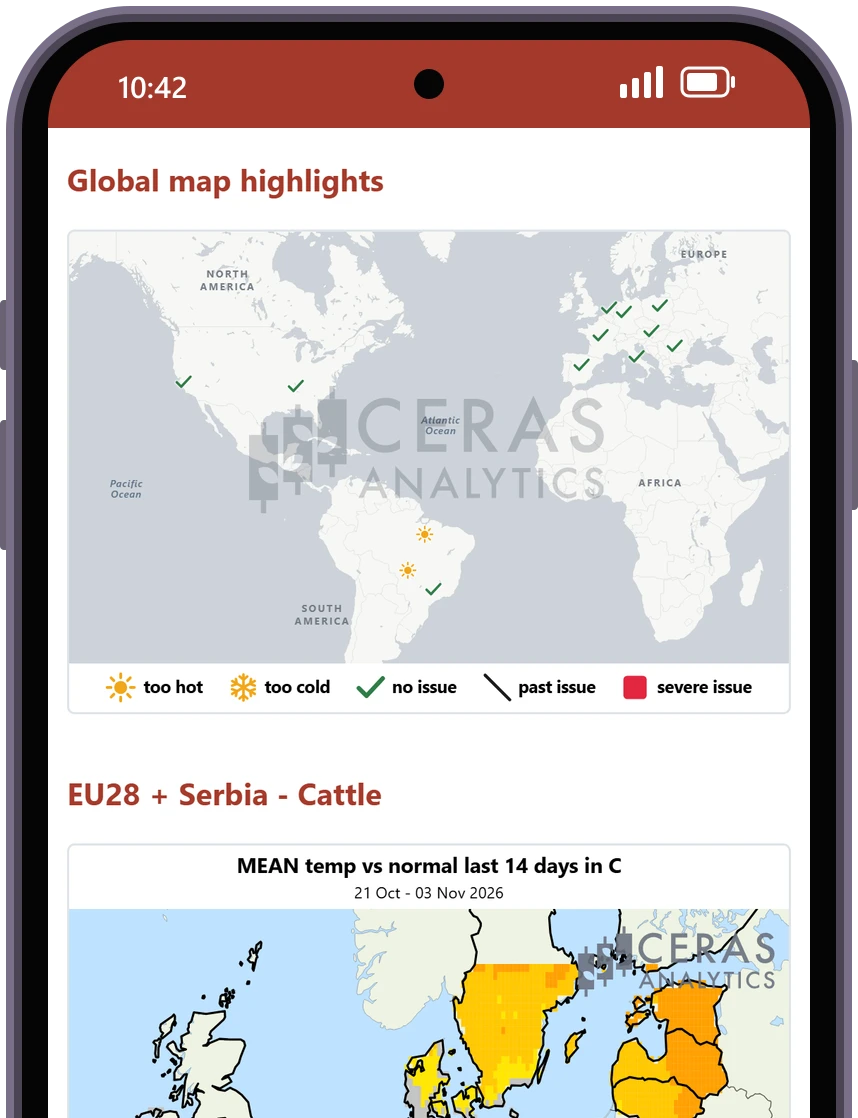
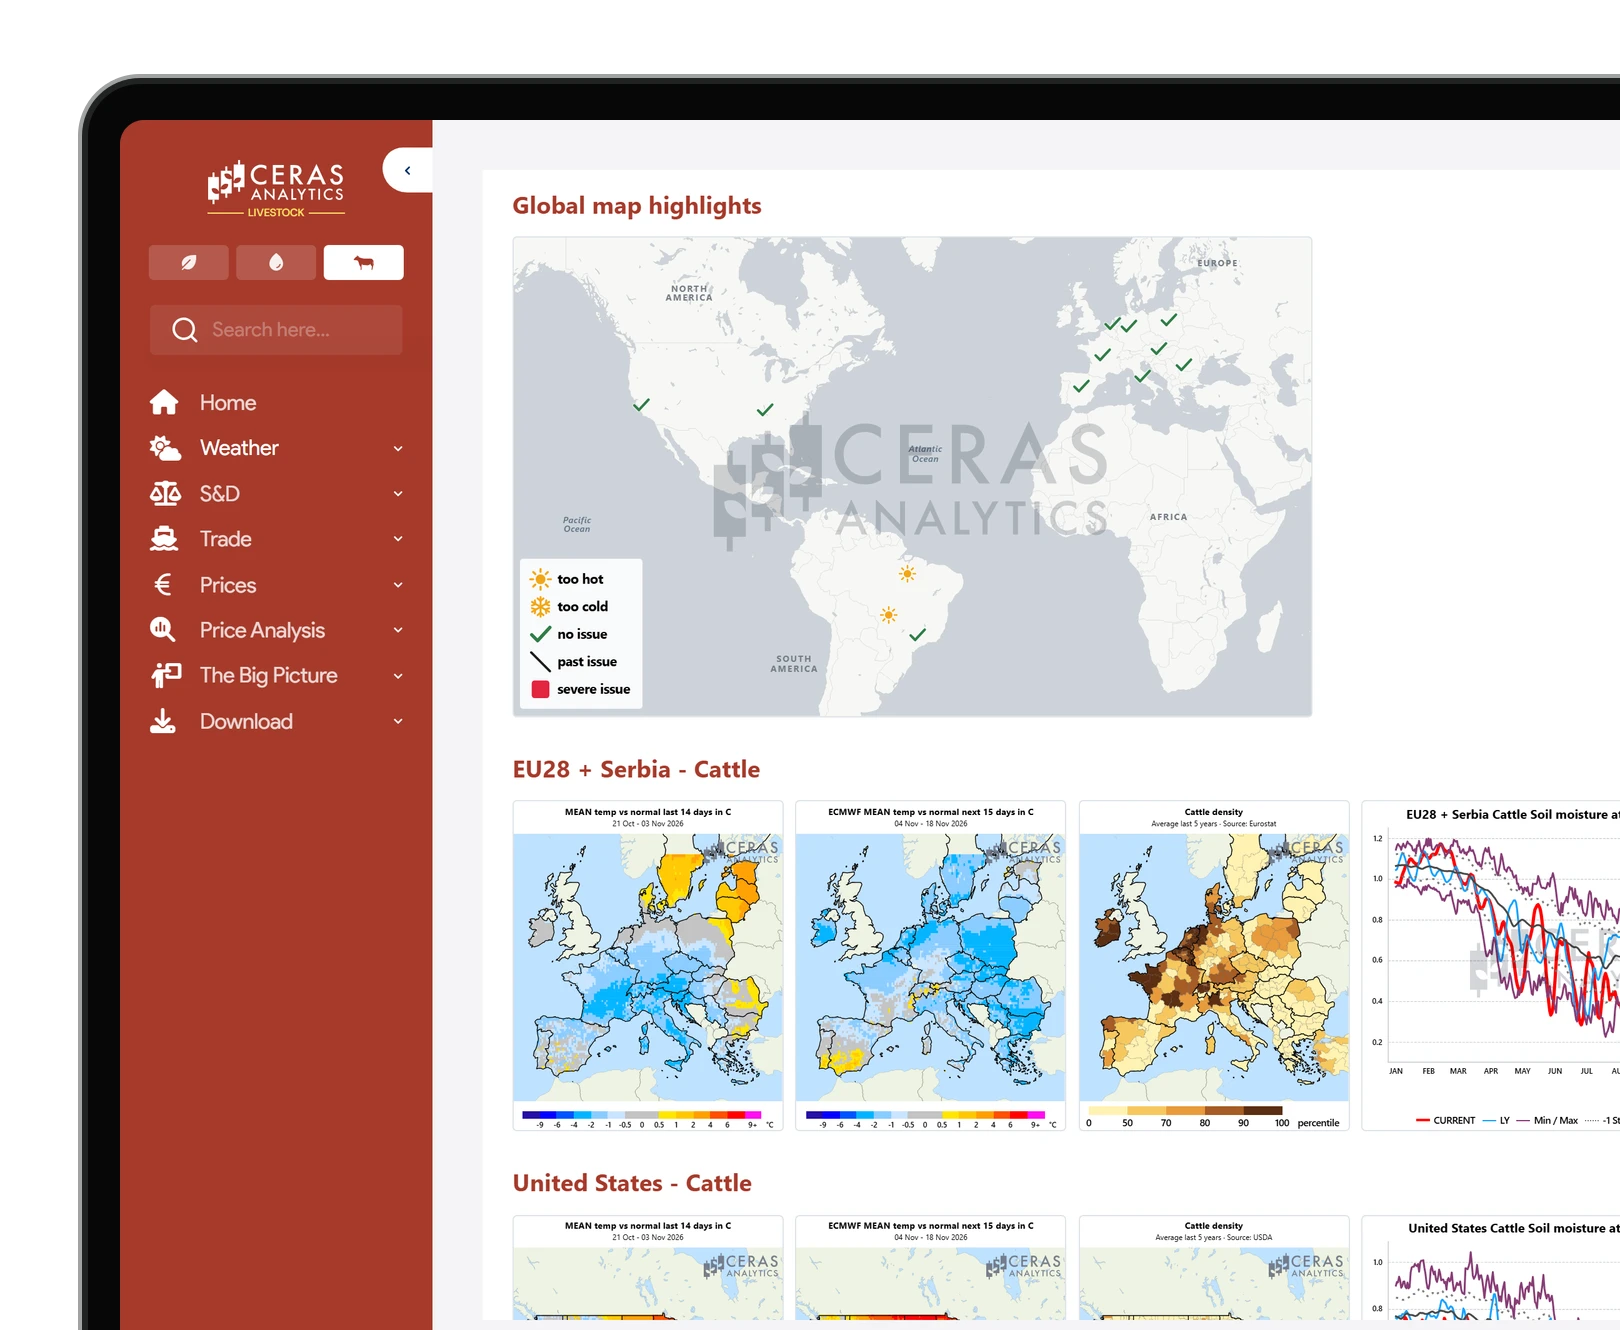
Our weather products deliver daily updates through maps and charts, covering key livestock areas worldwide. These charts show the weather developments throughout the growing season, comparing current conditions to historical norms, and include the latest GFS and ECMWF forecasts. All data is production-weighted to reflect the regions where most livestock lives, providing accurate and relevant insights for decision-makers.
Daily Compact Weather Report
A streamlined daily summary featuring charts and maps comparing actual weather to normal conditions over the past two weeks, along with a two-week forward forecast. Including global map highlights where we show all weather issues for livestock in one glance.

Prices
Know which origin competes.
Follow livestock and meat prices from the farm gate to the futures market. Compare weekly cash prices across the main EU countries and key world markets, and track US livestock and dairy futures alongside European butter and SMP, all in one place.
Livestock Cash Prices
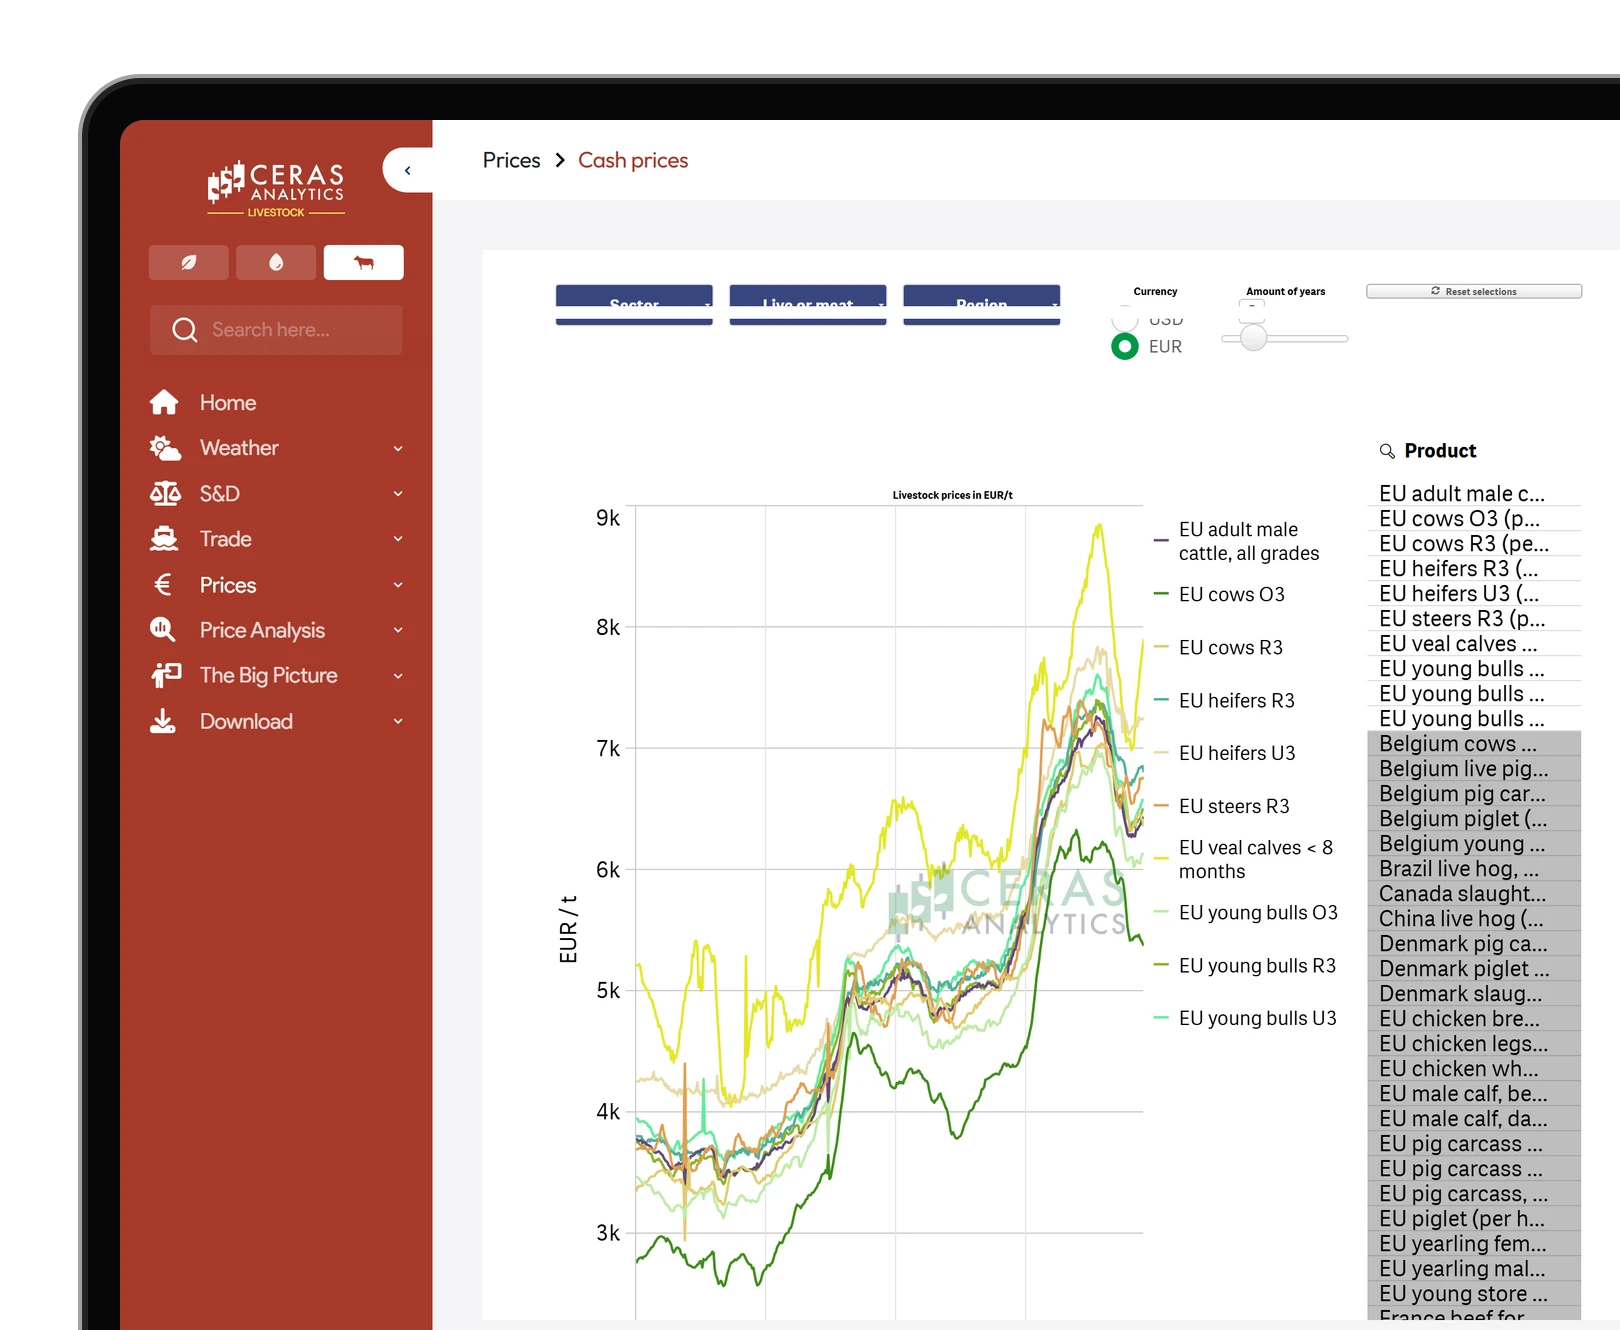
Chart and compare more than 140 weekly cash price series for cattle and beef, pigs and pork, and poultry. Choose live animals or meat (carcasses and cuts) for nine EU countries, the UK, the EU as a whole, the US, Brazil, Canada and China, in EUR or USD. Coverage ranges from EU carcass grades for young bulls, cows, heifers and steers, calves and piglets, to slaughter pig and live hog quotations such as VEZG, Mercolleida, Danish Crown and Iowa, pork primals, and chicken breast, legs and whole birds.

Price analysis
In-depth price insights to sharpen your strategy.
Price Analysis puts livestock prices in context. See whether farmers and packers make or lose money at today's prices, where the futures stand technically, and how speculative and index funds are positioned, so you can judge where supply and prices are likely to move next.
Margins
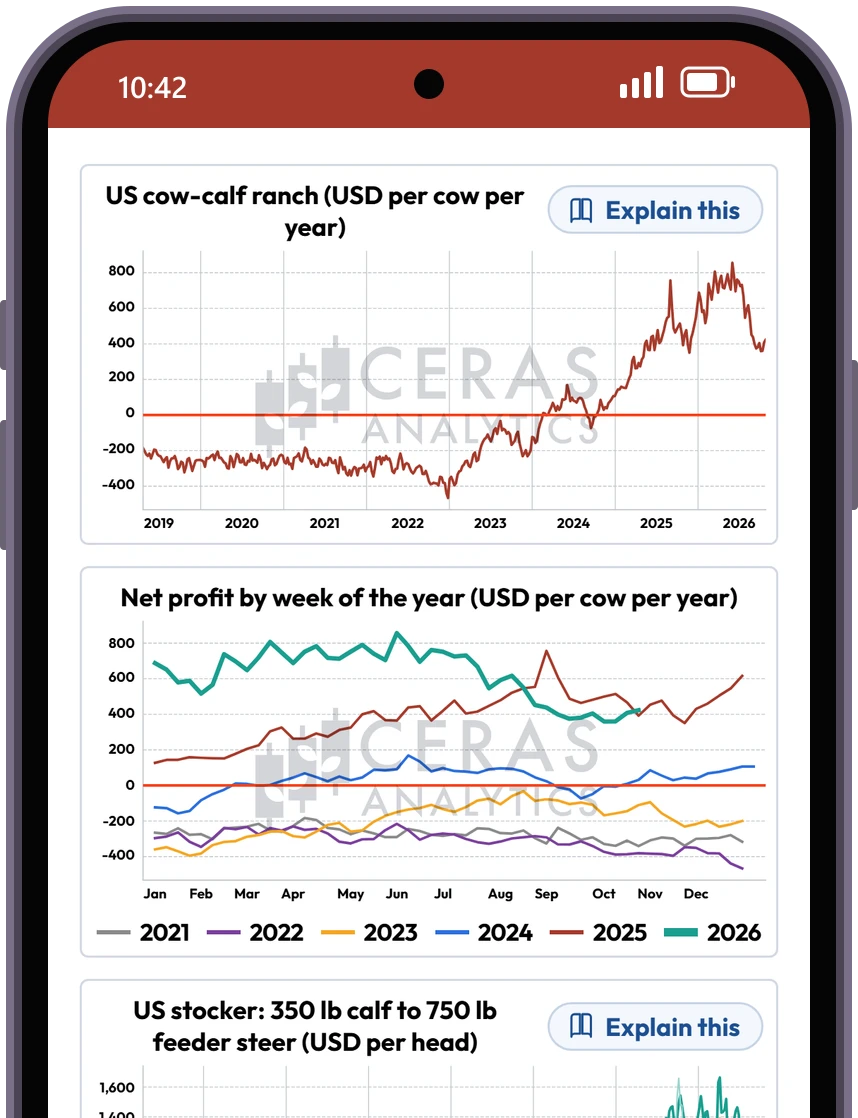
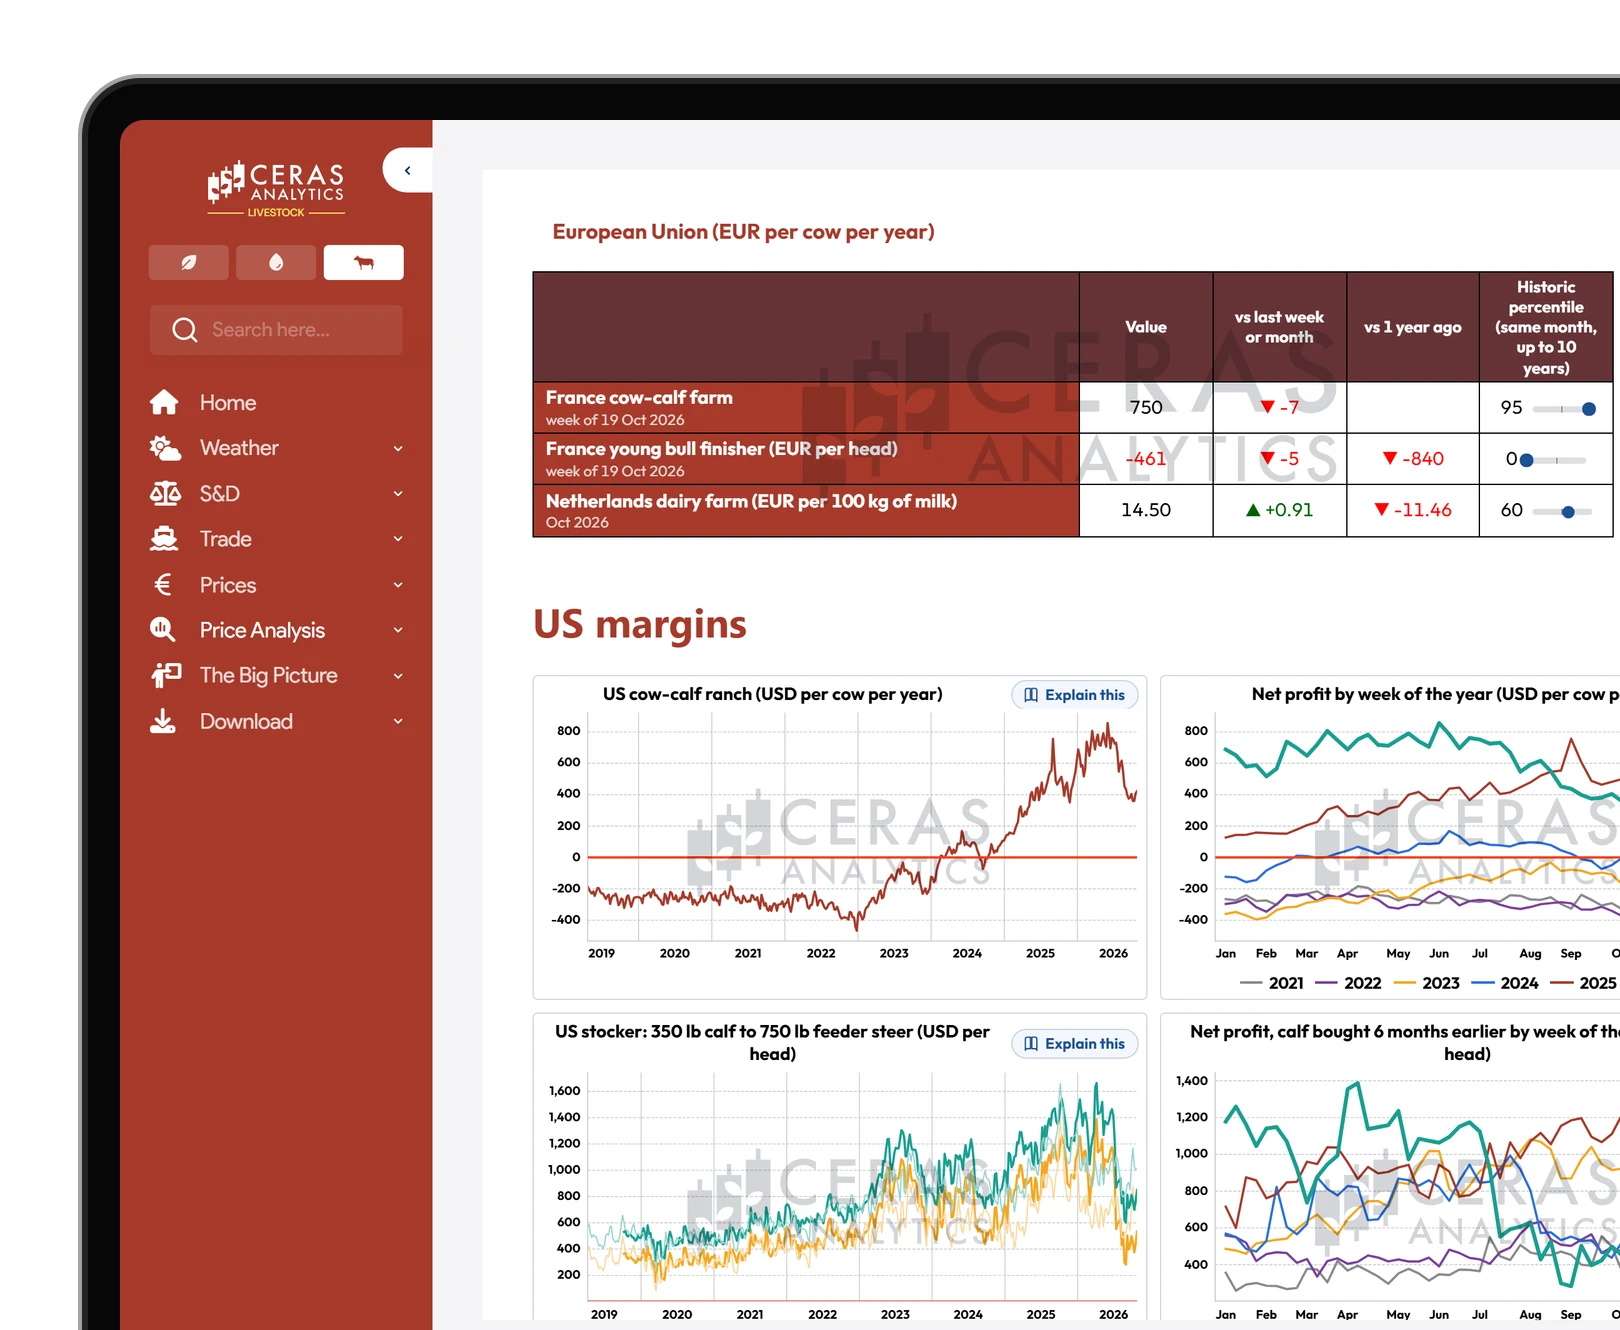
Know who is making money in the chain. Our margins follow every stage of production for cattle, hogs, poultry and dairy, in the US and the EU, with Brazil and China added for poultry and eggs. They run from cow-calf, stocker and feedlot to the beef packer, from sow farm and finisher to pork cutting, and from broiler and egg farms to the retail counter. Each margin is shown against last week, last year and its historic range for the same month, with seasonal charts and a comparison of animals bought months earlier against today's prices. Today's losses are tomorrow's supply cuts.
Big Picture
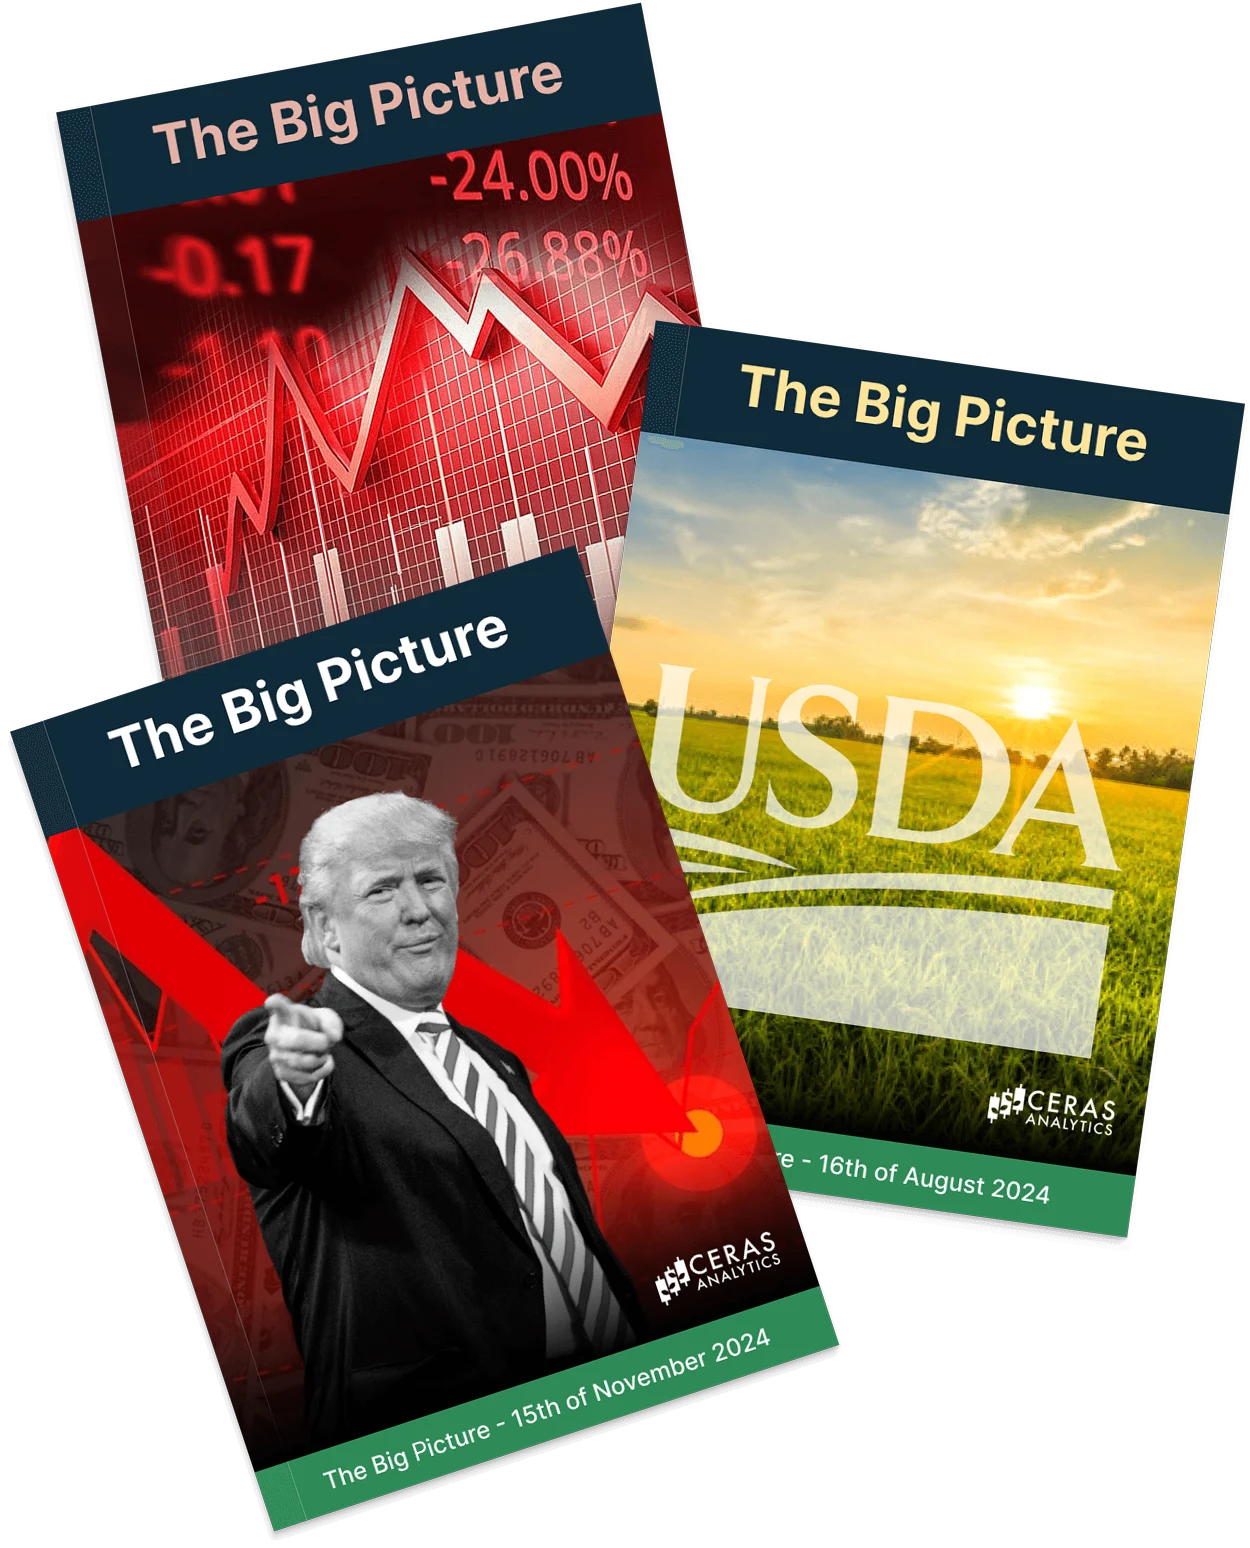
Always stay ahead of the livestock markets with The Big Picture Livestock, our monthly presentation of where cattle, hog and poultry markets stand and where they may be heading. Built on our own S&D, price, margin and fund positioning data, it starts with the whole complex on one page, gives a clear Ceras view per market, and tells you what to watch next. The Big Picture Livestock combines several insights:
Fundamentals
Supply and demand for cattle and beef, hogs and pork, and chicken: herd and flock trends, disease and trade policy, and where our balances differ from USDA.
Outside markets
How energy and freight, inflation and interest rates, currencies, feed costs and fund positioning shape costs, demand and prices for meat.
Price outlook
A scorecard per market that rates fundamentals, futures, cash prices and funds from bearish to bullish, with benchmark cash prices compared to a year ago.
What to watch
A calendar of the reports, policy decisions and events that can move the market in the weeks ahead, plus what-if scenarios with our read on each.
Big Picture
Always stay ahead of the livestock markets with The Big Picture Livestock, our monthly presentation of where cattle, hog and poultry markets stand and where they may be heading. Built on our own S&D, price, margin and fund positioning data, it starts with the whole complex on one page, gives a clear Ceras view per market, and tells you what to watch next. The Big Picture Livestock combines several insights:
Fundamentals
Supply and demand for cattle and beef, hogs and pork, and chicken: herd and flock trends, disease and trade policy, and where our balances differ from USDA.
Outside markets
How energy and freight, inflation and interest rates, currencies, feed costs and fund positioning shape costs, demand and prices for meat.
Price outlook
A scorecard per market that rates fundamentals, futures, cash prices and funds from bearish to bullish, with benchmark cash prices compared to a year ago.
What to watch
A calendar of the reports, policy decisions and events that can move the market in the weeks ahead, plus what-if scenarios with our read on each.



Download & API
This gives you direct access to the raw data behind the products you subscribe to. This feature is designed for businesses looking to dive deeper, and allows you to seamlessly integrate our datasets into your systems and models. We handle the data collection, so all you have to do is focus on what matters most; leveraging insights to drive smarter, more strategic decisions for your business.

Download
Direct access to the raw data of all products you purchase.
